Session Trend Predictor-excillionSession Trend Predictor - Excillion
Created by: (Excillion)
🧠 What This Script Does
Session Trend Predictor highlights specific trading sessions (like the New York session or any custom intraday range) directly on the chart, helping traders visually analyze price behavior within those time windows. It draws color-coded boxes around each session and assigns a simple trend signal (📈 or 📉) at the end of the session based on how price behaved during that time.
🔍 How It Works
The script tracks two customizable sessions per day. For each session:
It captures key price data:
Session Open
Session Close
Session High
Session Low
Average price across the session
It applies a basic trend classification logic:
A trend is detected by comparing the opening and closing prices
If the session is indecisive, no signal is shown.
Session Boxes:
A shaded box is drawn from the session’s start to end candle, stretching from session low to high, with optional outlines and a label showing the trend direction if detected.
⚙️ Customizable Settings
Session Time Settings: Define start and end hours/minutes for both sessions.
Color and Transparency: Choose base colors for each session box and adjust transparency for better visibility.
Display Options: Show or hide box outlines and trend emojis for a cleaner chart if desired.
🧭 How to Use It
Use the indicator to observe how price behaves within each session.
Watch for trend signals (📈 / 📉) at the end of each session as a way to confirm or reject trade ideas.
Combine with support/resistance levels or price action strategies for more informed intraday or session-based trades.
Ideal for beginners and visual traders who want simple, session-focused trend cues.
This indicator simplifies session analysis by automatically marking trading ranges and suggesting a directional bias based on session dynamics—no complicated indicators or settings needed.
In highly Volatile markets, ensure you utilize other confluences to determine your entries.
ابحث في النصوص البرمجية عن "session high"

AMD Liquidity Sweep with AlertsAMD Liquidity Sweep with Alerts
Identify key liquidity levels from the Asian trading session with visual markers and alerts.
📌 Key Features:
Asia Session Detection
Customizable start/end hours (0-23) to match your trading timezone
Automatically calculates session high/low
Smart Swing Level Identification
Finds the closest significant swing high ≥ Asia high
Finds the closest significant swing low ≤ Asia low
Adjustable pivot sensitivity (# of left/right bars)
Professional Visuals
Dashed reference lines extending into the future
Blue-highlighted key levels
Clean label formatting with precise price levels
Trading Alerts
Price-cross alerts for liquidity breaks
Visual markers (triangles) when levels are breached
Separate alerts for buy-side/sell-side liquidity
Customization Options
Toggle intermediate swing highlights
Adjust label sizes
💡 Trading Applications:
Institutional Levels: Identify zones where Asian session liquidity pools exist
Breakout Trading: Get alerted when price breaches Asian session ranges
S/R Flip Zones: Watch how price reacts at these key reference levels
London/NY Open: Use Asian levels for early European session trades
🔧 How to Use:
Set your preferred Asia session hours
Adjust pivot sensitivity (default 1 bar works for most timeframes)
Enable alerts for breakouts if desired
Watch for reactions at the plotted levels

Apex Edge - MTF Confluence PanelApex Edge – MTF Confluence Panel
Description:
The Apex Edge – MTF Confluence Panel is a powerful multi-timeframe analysis tool built to streamline trade decision-making by aggregating key confluences across three user-defined timeframes. The panel visually presents the state of five core market signals—Trend, Momentum, Sweep, Structure, and Trap—alongside a unified Score column that summarizes directional bias with clarity.
Traders can customize the number of bullish/bearish conditions required to trigger a score signal, allowing the tool to be tailored for both conservative and aggressive trading styles. This script is designed for those who value a clean, structured, and objective approach to identifying market alignment—whether scalping or swing trading.
How it Works:
Across each of the three selected timeframes, the panel evaluates:
Trend: Based on a user-configurable Hull Moving Average (HMA), the script compares price relative to trend to determine bullish, bearish, or neutral bias.
Momentum: Uses OBV (On-Balance Volume) with volume spike detection to identify bursts of strong buying or selling pressure.
Sweep: Detects potential liquidity grabs by identifying price rejections beyond prior swing highs/lows. A break below a previous low with reversal signals bullish intent (and vice versa for bearish).
Structure: Uses dynamic pivot-based logic to identify market structure breaks (BOS) beyond recent confirmed swing levels.
Trap: Flags potential false moves by measuring RSI overbought/oversold signal clusters combined with minimal price movement—highlighting exhaustion or deceptive breaks.
Score: A weighted consensus of the above components. The number of required confluences to trigger a score (default: 3) can be set by the user via input, offering flexibility in signal sensitivity.
Why It’s Useful for Traders:
Quick Decision-Making: The color-coded panel provides instant visual feedback on whether confluences align across timeframes—ideal for fast-paced environments like scalping or high-volatility news sessions.
Multi-Timeframe Confidence: Helps eliminate guesswork by confirming whether higher and lower timeframe conditions support your trade idea.
Customizability: Adjustable confluence threshold means traders can fine-tune how sensitive the system is—more signals for faster entries, stricter confluence for higher conviction trades.
Built-In Alerts: Automated alerts for score alignment, trap detection, and liquidity sweeps allow traders to stay informed even when away from the screen.
Strategic Edge: Supports directional bias confirmation and trade filtering with logic designed to mimic professional decision-making workflows.
Features:
Clean, real-time confluence table across three user-selected timeframes
Configurable score sensitivity via “Minimum Confluences for Score” input
Cell-based colour coding for at-a-glance trade direction
Built-in alerts for score alignment, traps, and sweep triggers
Note - This Indicator works great in sync with Apex Edge - Session Sweep Pro
Useful levels for TP = previous session high/low boxes or fib levels.
⚠️ Disclaimer:
This script is for informational and educational purposes only and should not be considered financial advice. Always perform your own due diligence and practice proper risk management when trading.

Opening Range and Market BoundariesOpening Range and Market Boundaries
This versatile and insightful indicator combines two powerful concepts frequently used by professional traders: Opening Range Analysis and Market Boundaries derived from previous high/low levels. It is specifically designed to support intraday trading strategies and helps you identify key price zones for entries, exits, and breakout confirmations.
🔍 Features & Utility
1. Opening Range Box
What it does:
Highlights the high and low of the first candle after market open (9:15 AM IST) with a shaded box. This box spans the full trading session, from 9:15 AM to 3:30 PM, representing the key price range where the initial balance is formed.
Timeframe Compatibility:
The Opening Range box is optimized for 1-minute to 1-hour charts. It is most effective on lower timeframes (1m, 5m, 15m, 30m) where intraday price movements and breakout patterns can be clearly observed.
Usage Tips:
Breakouts above or below the Opening Range box can signal potential directional bias for the rest of the trading day.
Price consolidating within the range may indicate a choppy or range-bound session.
Works well with volume and momentum indicators for confirmation.
2. Market Boundaries
What it does:
Plots horizontal lines at:
Previous Day High/Low
Previous Week High/Low
Previous Month High/Low
Why it matters:
These levels act as natural support and resistance zones, and are commonly watched by institutional traders, making them crucial for:
Spotting reversals or breakouts
Planning stop-loss and target zones
Avoiding trades around high-rejection areas
Customization Options:
Toggle ON/OFF for Daily, Weekly, and Monthly levels.
Independent colors and line thickness for each level, enabling you to distinguish between different timeframes easily.
🛠️ How to Use Effectively
Use during market open:
Switch to a 5-minute or 15-minute chart during the first few candles of the session. Observe the Opening Range box formation and plan trades based on breakout direction.
Confluence Trading:
Look for price action near previous session highs/lows in confluence with the Opening Range box edges. These intersections often become high-probability zones for breakouts or reversals.
Session Preparation:
Before the market opens, analyze where the price is relative to past high/low boundaries. If it's near a weekly/monthly level, be cautious — those areas can cause whipsaws or false breakouts.
Avoid low-volume breakouts:
Use this indicator in conjunction with volume tools or price action confirmation to validate the strength of a move outside the Opening Range or Market Boundaries.
📌 Summary
This indicator is designed for intraday traders, scalpers, and swing traders who want a reliable structure to guide their decisions. It visually marks the opening balance of the market and essential higher timeframe boundaries, helping you trade with discipline and precision.

London/NY Sessions + SMC Levels📜 Indicator Description: London/NY Sessions + SMC Levels
Overview: This indicator highlights the key trading sessions — London, New York, NY Lunch, and Asian Range — providing structured visual guides based on Smart Money Concepts (SMC) and ICT principles.
It dynamically plots:
Session Backgrounds and Boxes for London, NY, Lunch, and Asian sessions
Reference Levels for the High, Low, and Close from today, previous day, or weekly data
Midnight Open line for ICT-style power of three setups
Real-time alerts for session starts, session closes, and important price level crossings
Features:
🕰️ Session Visualization:
Toggle London, NY, Lunch, and Asian session ranges individually, with customizable colors and transparent backgrounds.
🔔 Built-in Alerts:
Alerts for:
Price crossing the previous day's high/low
Price crossing the Midnight Open
Start and end of major sessions (London, NY, Lunch, Asian)
🟩 Reference Levels:
Plot selectable session reference levels:
Today’s intraday High/Low/Close
Previous Day’s High/Low/Close
This Week’s or Previous Week’s levels for broader context.
🌙 Midnight Open:
Track the Midnight New York Open as a reference point for daily bias shifts.
🎯 Customizable Settings:
Choose your session time zones (UTC, New York, London, etc.)
Customize all border colors, background colors, and session hours.
Use Cases:
Identify killzones and optimal trade entry windows for Smart Money Concepts (SMC) and ICT strategies.
Monitor liquidity pool sweeps and session transitions.
Confirm or refine your intraday or swing trading setups by referencing session highs/lows.
Recommended For:
ICT traders
Smart Money Concepts (SMC) practitioners
Forex, indices, crypto, and futures traders focusing on session-based volatility patterns
Anyone wanting a clean, professional session mapping tool
📈
Designed to help you trade with session precision and Smart Money accuracy.
Integrates seamlessly into any ICT, Wyckoff, or Liquidity-based trading approach.

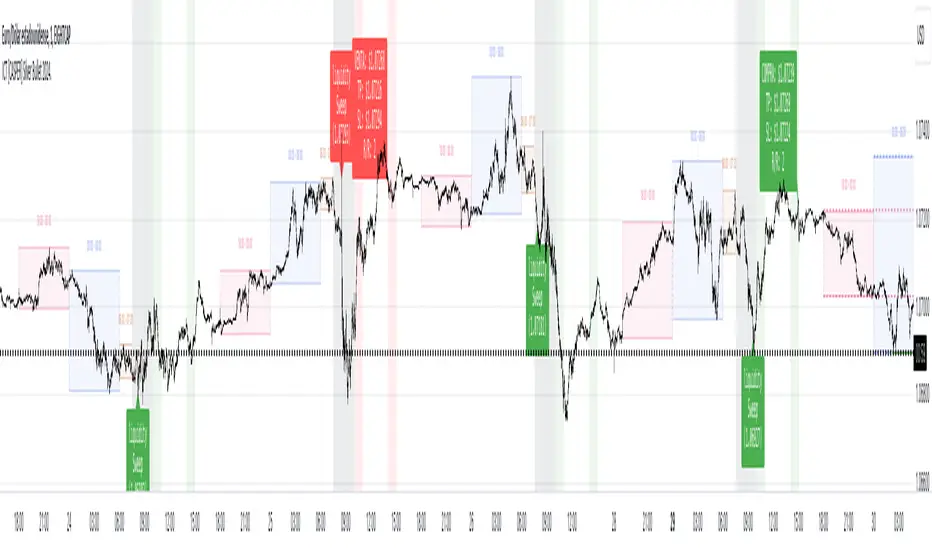
ICT Bread and Butter Sell-SetupICT Bread and Butter Sell-Setup – TradingView Strategy
Overview:
The ICT Bread and Butter Sell-Setup is an intraday trading strategy designed to capitalize on bearish market conditions. It follows institutional order flow and exploits liquidity patterns within key trading sessions—London, New York, and Asia—to identify high-probability short entries.
Key Components of the Strategy:
🔹 London Open Setup (2:00 AM – 8:20 AM NY Time)
The London session typically sets the initial directional move of the day.
A short-term high often forms before a downward push, establishing the daily high.
🔹 New York Open Kill Zone (8:20 AM – 10:00 AM NY Time)
The New York Judas Swing (a temporary rally above London’s high) creates an opportunity for short entries.
Traders fade this move, anticipating a sell-off targeting liquidity below previous lows.
🔹 London Close Buy Setup (10:30 AM – 1:00 PM NY Time)
If price reaches a higher timeframe discount array, a retracement higher is expected.
A bullish order block or failure swing signals a possible reversal.
The risk is set just below the day’s low, targeting a 20-30% retracement of the daily range.
🔹 Asia Open Sell Setup (7:00 PM – 2:00 AM NY Time)
If institutional order flow remains bearish, a short entry is taken around the 0-GMT Open.
Expect a 15-20 pip decline as the Asian range forms.
Strategy Rules:
📉 Short Entry Conditions:
✅ New York Judas Swing occurs (price moves above London’s high before reversing).
✅ Short entry is triggered when price closes below the open.
✅ Stop-loss is set 10 pips above the session high.
✅ Take-profit targets liquidity zones on higher timeframes.
📈 Long Entry (London Close Reversal):
✅ Price reaches a higher timeframe discount array between 10:30 AM – 1:00 PM NY Time.
✅ A bullish order block confirms the reversal.
✅ Stop-loss is set 10 pips below the day’s low.
✅ Take-profit targets 20-30% of the daily range retracement.
📉 Asia Open Sell Entry:
✅ Price trades slightly above the 0-GMT Open.
✅ Short entry is taken at resistance, targeting a quick 15-20 pip move.
Why Use This Strategy?
🚀 Institutional Order Flow Tracking – Aligns with smart money concepts.
📊 Precise Session Timing – Uses market structure across London, New York, and Asia.
🎯 High-Probability Entries – Focuses on liquidity grabs and engineered stop hunts.
📉 Optimized Risk Management – Defined stop-loss and take-profit levels.
This strategy is ideal for traders looking to trade with institutions, fade liquidity grabs, and capture high-probability short setups during the trading day. 📉🔥

Price Alert Indicator with TableIndicator Description: Price Alert Indicator with Table
The Custom Price Alert Indicator with Table is a TradingView script designed to help traders monitor and react to significant price levels during the Asian and London trading sessions. This indicator provides visual alerts and displays relevant session data in a user-friendly table format.
Key Features:
User-Defined Session Times:
Users can specify the start and end hours for both the Asian (default: 8 AM to 2 PM) and London (default: 2 PM to 8 PM) trading sessions in their local time zone.
This flexibility allows traders from different regions to customize the indicator according to their trading hours.
Real-Time Highs and Lows:
The indicator calculates and tracks the high and low prices for the Asian and London sessions in real-time.
It continuously updates these values as new price data comes in.
Touch Notification Logic:
Alerts are triggered when the price touches the session high or low points.
Notifications are designed to avoid repetition; if the London session touches the Asian high or low, subsequent touches are not alerted until the next trading day.
Interactive Table Display:
A table is presented in the bottom right corner of the chart, showing:
The Asian low and high prices
The London low and high prices
Whether each price level has been touched.
Touched levels are visually highlighted in green, making it easy for traders to identify relevant price actions.
Daily Reset of Notifications:
The notification statuses are reset at the end of the London session each day, preparing for the next day’s trading activity.
Use Cases:
Traders can utilize this indicator to stay informed about pivotal price levels during important trading sessions, aiding in decision-making and strategy development.
The clear visual representation of price levels and touch statuses helps traders quickly assess market conditions.
This indicator is particularly beneficial for day traders and those who focus on price movements around key high and low points during the trading day.

Gap Down Reversal Strategy█ STRATEGY OVERVIEW
The "Gap Down Reversal Strategy" capitalizes on price recovery patterns following bearish gap-down openings. This mean-reversion approach enters long positions on confirmed intraday recoveries and exits when prices breach previous session highs. This strategy is NOT optimized.
█ What is a Gap Down Reversal?
A gap down reversal occurs when:
An instrument opens significantly below its prior session's low (price gap)
Selling pressure exhausts itself during the session
Buyers regain control, pushing price back above the opening level
Creates a candlestick with:
• Open < Prior Session Low (true gap)
• Close > Open (bullish reversal candle)
█ SIGNAL GENERATION
1. LONG ENTRY CONDITION
Previous candle closes BELOW its opening price (bearish candle)
Current session opens BELOW prior candle's low (gap down)
Current candle closes ABOVE its opening price (bullish reversal)
Executes market order at session close
2. EXIT CONDITION
A Sell Signal is generated when the current closing price exceeds the highest high of the previous seven bars (`close > _highest `). This indicates that the price has shown strength, potentially confirming the reversal and prompting the strategy to exit the position.
█ PERFORMANCE OVERVIEW
Ideal Market: High volatility instruments with frequent gaps
Key Risk: False reversals in sustained downtrends
Optimization Tip: Test varying gap thresholds (1-3% ranges)

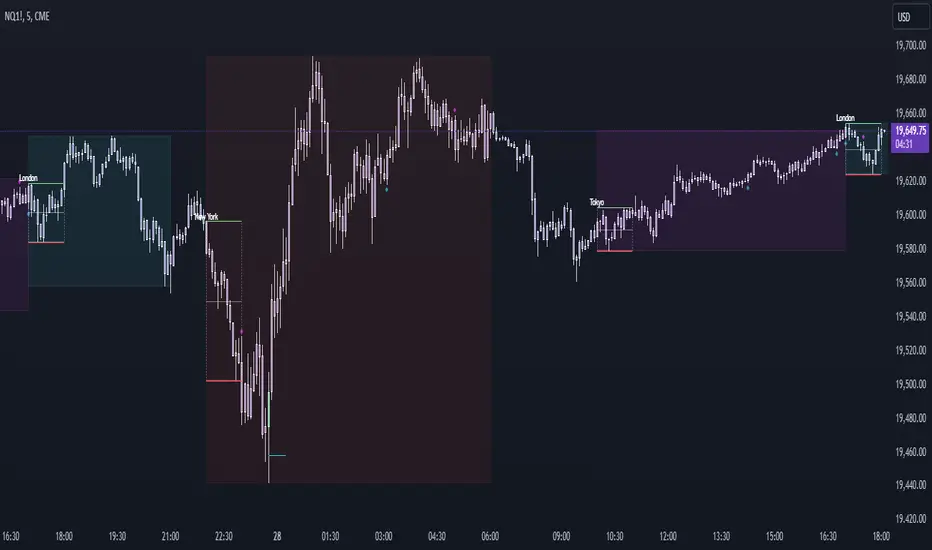
London/NY Sessions [jpkxyz]London/NY Sessions Indicator Guide
This indicator tracks the forex market's most active trading periods: London session, New York session, and their overlap.
This characteristics of the London and New York trading sessions are well documented and many traders use them as a key element in their trading strategies. It is most relevant in forex trading, however it is to an extend also applicable in cryptocurrencies.
London Session (08:00-16:00 UTC)
Most active trading session (35% of daily forex volume)
Highest trading volume and liquidity
Major price movements and trend development
Significant institutional participation
New York Session (13:00-20:00 UTC)
Second most active trading period
High institutional order flow
Major US economic releases
Significant impact on USD pairs
London/New York Overlap (13:00-16:00 UTC)
The most active period in forex markets:
Maximum market liquidity
Highest daily trading volume
Strong price movements
Tightest spreads
Peak institutional activity
This indicator helps traders:
Visualize key trading sessions
Track session highs and lows
Monitor overlap dynamics
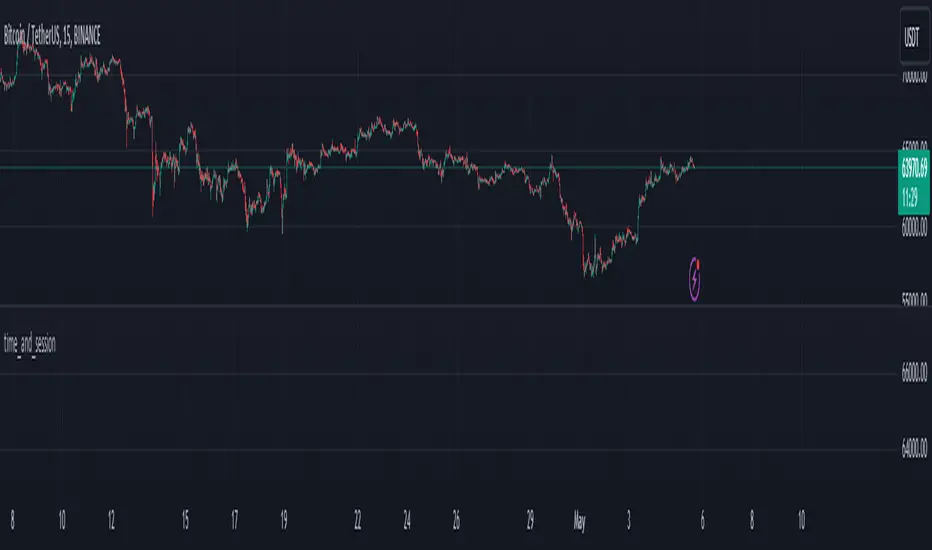
Identify potential support/resistance levels (session highs/lows)

time_and_sessionA library that provides utilities for working with trading sessions and time-based conditions. Functions include session checks, date range checks, day-of-week matching, and session high/low calculations for daily, weekly, monthly, and yearly timeframes. This library streamlines time-related calculations and enhances time-based strategies and indicators.
Library "time_and_session"
Provides functions for checking time and session-based conditions and retrieving session-specific high and low values.
is_session(session, timeframe, timezone)
Checks if the current time is within the specified trading session
Parameters:
session (string) : The trading session, defined using input.session()
timeframe (string) : The timeframe to use, defaults to the current chart's timeframe
timezone (string) : The timezone to use, defaults to the symbol's timezone
Returns: A boolean indicating whether the current time is within the specified trading session
is_date_range(start_time, end_time)
Checks if the current time is within a specified date range
Parameters:
start_time (int) : The start time, defined using input.time()
end_time (int) : The end time, defined using input.time()
Returns: A boolean indicating whether the current time is within the specified date range
is_day_of_week(sunday, monday, tuesday, wednesday, thursday, friday, saturday)
Checks if the current day of the week matches any of the specified days
Parameters:
sunday (bool) : A boolean indicating whether to check for Sunday
monday (bool) : A boolean indicating whether to check for Monday
tuesday (bool) : A boolean indicating whether to check for Tuesday
wednesday (bool) : A boolean indicating whether to check for Wednesday
thursday (bool) : A boolean indicating whether to check for Thursday
friday (bool) : A boolean indicating whether to check for Friday
saturday (bool) : A boolean indicating whether to check for Saturday
Returns: A boolean indicating whether the current day of the week matches any of the specified days
daily_high(source)
Returns the highest value of the specified source during the current daily session
Parameters:
source (float) : The data series to evaluate, defaults to high
Returns: The highest value during the current daily session, or na if the timeframe is not suitable
daily_low(source)
Returns the lowest value of the specified source during the current daily session
Parameters:
source (float) : The data series to evaluate, defaults to low
Returns: The lowest value during the current daily session, or na if the timeframe is not suitable
regular_session_high(source, persist)
Returns the highest value of the specified source during the current regular trading session
Parameters:
source (float) : The data series to evaluate, defaults to high
persist (bool) : A boolean indicating whether to retain the last value outside of regular market hours, defaults to true
Returns: The highest value during the current regular trading session, or na if the timeframe is not suitable
regular_session_low(source, persist)
Returns the lowest value of the specified source during the current regular trading session
Parameters:
source (float) : The data series to evaluate, defaults to low
persist (bool) : A boolean indicating whether to retain the last value outside of regular market hours, defaults to true
Returns: The lowest value during the current regular trading session, or na if the timeframe is not suitable
premarket_session_high(source, persist)
Returns the highest value of the specified source during the current premarket trading session
Parameters:
source (float) : The data series to evaluate, defaults to high
persist (bool) : A boolean indicating whether to retain the last value outside of premarket hours, defaults to true
Returns: The highest value during the current premarket trading session, or na if the timeframe is not suitable
premarket_session_low(source, persist)
Returns the lowest value of the specified source during the current premarket trading session
Parameters:
source (float) : The data series to evaluate, defaults to low
persist (bool) : A boolean indicating whether to retain the last value outside of premarket hours, defaults to true
Returns: The lowest value during the current premarket trading session, or na if the timeframe is not suitable
postmarket_session_high(source, persist)
Returns the highest value of the specified source during the current postmarket trading session
Parameters:
source (float) : The data series to evaluate, defaults to high
persist (bool) : A boolean indicating whether to retain the last value outside of postmarket hours, defaults to true
Returns: The highest value during the current postmarket trading session, or na if the timeframe is not suitable
postmarket_session_low(source, persist)
Returns the lowest value of the specified source during the current postmarket trading session
Parameters:
source (float) : The data series to evaluate, defaults to low
persist (bool) : A boolean indicating whether to retain the last value outside of postmarket hours, defaults to true
Returns: The lowest value during the current postmarket trading session, or na if the timeframe is not suitable
weekly_high(source)
Returns the highest value of the specified source during the current weekly session. Can fail on lower timeframes.
Parameters:
source (float) : The data series to evaluate, defaults to high
Returns: The highest value during the current weekly session, or na if the timeframe is not suitable
weekly_low(source)
Returns the lowest value of the specified source during the current weekly session. Can fail on lower timeframes.
Parameters:
source (float) : The data series to evaluate, defaults to low
Returns: The lowest value during the current weekly session, or na if the timeframe is not suitable
monthly_high(source)
Returns the highest value of the specified source during the current monthly session. Can fail on lower timeframes.
Parameters:
source (float) : The data series to evaluate, defaults to high
Returns: The highest value during the current monthly session, or na if the timeframe is not suitable
monthly_low(source)
Returns the lowest value of the specified source during the current monthly session. Can fail on lower timeframes.
Parameters:
source (float) : The data series to evaluate, defaults to low
Returns: The lowest value during the current monthly session, or na if the timeframe is not suitable
yearly_high(source)
Returns the highest value of the specified source during the current yearly session. Can fail on lower timeframes.
Parameters:
source (float) : The data series to evaluate, defaults to high
Returns: The highest value during the current yearly session, or na if the timeframe is not suitable
yearly_low(source)
Returns the lowest value of the specified source during the current yearly session. Can fail on lower timeframes.
Parameters:
source (float) : The data series to evaluate, defaults to low
Returns: The lowest value during the current yearly session, or na if the timeframe is not suitable
ICT [CASPER] Silver Bullet 2024.ENGLISH DESCRIPTION:
The "BOT SILVER BULLET 2024" indicator is a technical analysis tool tailored for active traders on the TradingView platform, combining market pattern study with quantitative trading intelligence. This sophisticated indicator overlays directly on the price chart and is designed to pinpoint and visualize critical liquidity zones, providing traders with a strategic edge in their decision-making process.
Its utility lies in identifying "Liquidity Zones," which are key areas where significant price movements are anticipated due to the accumulation or release of market orders. These zones are often levels where large market participants have placed unexecuted orders, which can lead to sharp and swift movements once those levels are reached. Foreseeing these points can be crucial for strategies aiming to capture volatility or find optimal entry and exit points.
The "BOT SILVER BULLET 2024" does not just focus on the present but also delivers historical analysis by identifying "Session Highs/Lows" and "Global Highs/Lows." These are the extreme points that have been reached during specific and broad timeframes, respectively. Knowing these levels can offer a deeper understanding of how the price has reacted in the past under certain market conditions, hinting at possible areas of support and resistance.
Furthermore, the indicator provides an in-depth analysis that delves beneath the surface. The "Analysis" function of this indicator scrutinizes price and volume patterns and correlates them with known market events, providing traders with a more informed perspective on the market's potential direction. This feature is invaluable for those looking to understand the underlying forces moving prices and how they might impact trading strategies.
To enhance usability and visual user experience, the "BOT SILVER BULLET 2024" allows users to "View Range Labels." This feature adds clear labels to price zones of particular interest, such as the aforementioned liquidity zones and historical highs and lows. These labels act as annotations that help traders keep track of significant developments without the need for constant manual analysis.
The indicator also highlights "Liquidity Grabs," moments when the price is anticipated to react significantly upon reaching levels previously identified with a high volume of pending orders. This information is pivotal for traders employing breakout or reversal strategies, as such price movements can provide profitable opportunities.
In summary, the "BOT SILVER BULLET 2024" indicator is a highly advanced tool and posits itself as one of the "most comprehensive market indicators." Its ability to provide an integrated view of the financial markets makes it indispensable for traders seeking to understand and anticipate price movements. Its amalgamation of historical data, alongside real-time visualization of market conditions, makes this tool not just comprehensive but also pertinent in today's dynamic trading environment. With its focus on liquidity and superior technical analysis, this indicator stands out as a true differentiator for serious traders looking to maximize their effectiveness in the financial markets.
DESCRIPCION EN ESPAÑOL:
El indicador "BOT SILVER BULLET 2024" es una herramienta de análisis técnico proyectada para operadores activos en la plataforma TradingView, con un diseño que fusiona el estudio de patrones de mercado y la inteligencia de trading cuantitativo. Este sofisticado indicador se integra directamente sobre el gráfico de precios y está diseñado para detectar y visualizar zonas críticas de liquidez, proporcionando a los operadores una ventaja estratégica en su toma de decisiones.
Su utilidad radica en la identificación de "Zonas de Liquidez", que son áreas clave donde se espera que ocurran movimientos significativos de precios debido a la acumulación o liberación de órdenes de mercado. Estas zonas son a menudo niveles donde los grandes participantes del mercado han colocado órdenes no ejecutadas, lo que puede dar lugar a movimientos rápidos y agudos una vez que se alcanzan esos niveles. La capacidad de prever estos puntos puede ser crucial para estrategias que buscan capturar volatilidad o encontrar puntos de entrada y salida óptimos.
El "BOT SILVER BULLET 2024" no sólo se enfoca en el presente, sino que también proporciona un análisis histórico mediante la identificación de "Altos/Bajos de Sesiones" y "Altos/Bajos Globales". Estos son los puntos extremos que han sido alcanzados durante períodos de tiempo específicos y generalizados, respectivamente. Conocer estos niveles puede ofrecer una comprensión más profunda de cómo el precio ha reaccionado en el pasado bajo ciertas condiciones de mercado, dando pistas sobre posibles áreas de soporte y resistencia.
Además, el indicador ofrece un análisis en profundidad que va más allá de la superficie. La función "Análisis" de este indicador examina patrones de precios y volúmenes, y los correlaciona con eventos de mercado conocidos, lo que proporciona a los traders una perspectiva más informada sobre la dirección potencial del mercado. Esta característica es invaluable para aquellos que buscan entender las fuerzas subyacentes que mueven los precios y cómo podrían afectar sus estrategias de trading.
Para mejorar la usabilidad y la experiencia visual del usuario, "BOT SILVER BULLET 2024" permite "Ver Etiquetas de Rangos". Esta función agrega etiquetas claras a las zonas de precio que son de particular interés, como las mencionadas zonas de liquidez, y los altos y bajos históricos. Estas etiquetas son una forma de anotación que ayuda a los operadores a mantenerse al tanto de los desarrollos significativos sin la necesidad de realizar un análisis manual constante.
El indicador también resalta las "Tomas de Liquidez", que son momentos en los que se espera que el precio reaccione de manera significativa al alcanzar niveles previamente identificados con un alto volumen de órdenes pendientes. Esta información es crucial para los traders que aplican estrategias de breakout o de reversión, ya que tales movimientos de precios pueden proporcionar oportunidades rentables.
Para resumir, el "BOT SILVER BULLET 2024" es un indicador altamente avanzado y se postula como uno de los "indicadores más completos del mercado". Su capacidad para proporcionar una vista integral de los mercados financieros lo hace indispensable para los traders que buscan comprender y anticipar movimientos de precios. Su integración de datos históricos, junto con la visualización en tiempo real de condiciones de mercado, hace que esta herramienta no solo sea completa sino también relevante en el dinámico entorno de trading actual. Con su enfoque en la liquidez y su análisis técnico superior, este indicador es un verdadero diferenciador para los traders serios que buscan maximizar su eficacia en los mercados financieros.
Vanitati's Market Scope=========================================================
How to Use the Indicator
=========================================================
Configuration: Begin by setting the session times to match your trading interests. Customize the colors and styles according to your preferences.
Observation: Watch for the high and low markers of each session to form the initial balance. Note how the price moves in relation to these levels.
Action: Pay special attention to God Candles and engulfing patterns, especially when they coincide with high volume. These may offer trading signals in line with your strategy.
Adjustment: Regularly review and adjust the settings (e.g., session times, lookback periods) based on market conditions and your trading performance.
=========================================================
Initial Balance (IB) Settings:
=========================================================
Purpose: Marks the high and low of a specific trading session to indicate the initial range of market movement.
Usage: Customize session times for New York (NY), London (LN), and Tokyo (TK) to see the initial balance of each. Colors for the high, low, and mid-point lines can be adjusted.
Practical Application: Traders can use these lines to gauge market volatility or breakouts outside of these initial ranges.
=========================================================
Session Settings and Session Highlight Boxes
=========================================================
Purpose: Highlights trading sessions with customizable background colors and border styles, allowing for a quick visual reference of market sessions.
Usage: Set the times for NY, London, and Tokyo sessions along with desired background colors to have these periods visually marked on the chart.
Practical Application: Helps in identifying the overlap between major market sessions and potential increases in trading volume and volatility.
=========================================================
God Candle Settings
=========================================================
Purpose: Identifies significantly large and voluminous candles, known as "God Candles", which could signal strong market movements.
Usage: Adjust the lookback period, line length, and volume criteria to define what constitutes a God Candle. These settings also allow for the display of diamonds on bars that meet certain criteria but are not classified as God Candles.
Practical Application: These candles can signal strong buying or selling pressure and might be used as potential entry or exit points based on the trader's strategy.
=========================================================
Additional Features
=========================================================
Session Time Filters: Allows for filtering signals based on the time of day, useful for focusing on specific market hours.
Engulfing Pattern Detection: The script includes logic to identify bullish and bearish engulfing patterns, adding another layer of analysis for potential trading opportunities.
Volume Analysis: Incorporates volume into the analysis of God Candles and engulfing patterns to identify significant market movements.
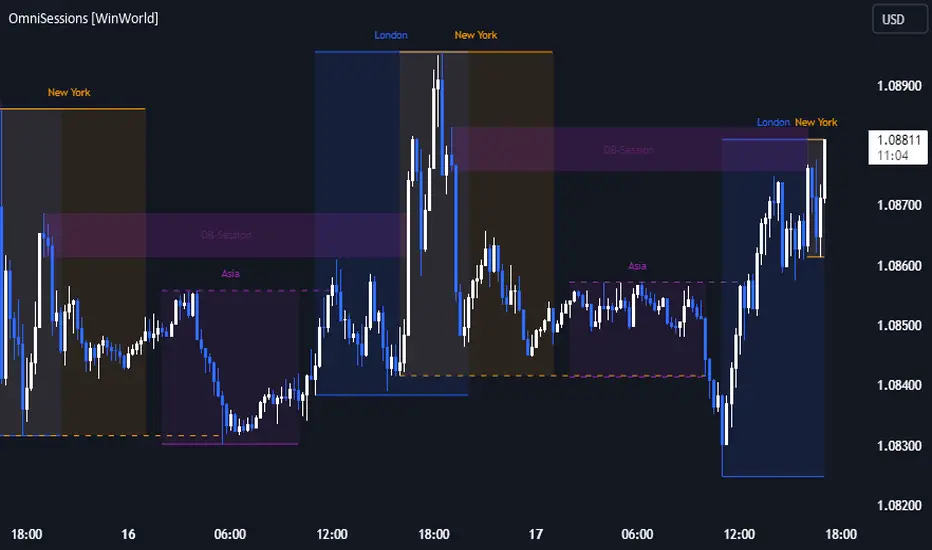
OmniSessions [WinWorld]The indicator shows the range of 4 most popular sessions (New York, Tokyo, London, Sydney). Sessions are used to identify zones with maximum volatility, as well as to find entry points. Session boundaries can act as POI no worse than OrderBlock.
In addition to sessions, you can use settings with KillZones - a range within a session that has potentially high volatility.
Silver Bullet is a more advanced range that allows you to identify the potential for maximum volatility. Excellent entry points can be obtained on the sweep of the range or from the nearest orderblock. We will explain it a bit deeply below.
Why use sessions?
During specific sessions big financial instutions from specific parts of the world enter the market, and this fact alone let us find the most "liquid" sessions in order to catch the best price movements. If talking about orderblocks, it is just a point of interest (more precisely, it is actually a zone of interest), which usually is a zone where the signficant amount of limit orders lies, and when price enter such zone, it immediately shows a strong reaction with either breakout from this zone or it bounces against this zone.
How is this indicator different from others?
There a lot of orderblocks indicator out here publicly available, but huge portion of them doesn't take into calculation important smart money concepts, such as valid pullbacks, for example. Valid pullbacks is a concept of price movement, which lets us indentify quite precisely price's impulses. Based on this impulses, we search our orderblocks. This approach allows to catch the most relevant and highly liquid orderblocks, which present traders with best trade entry opportunities, because usually, when entering with these orderblocks, you follow the moves of big money players, and that gives trader an edge in trading. None of open-source indicators uses such approach ( we've studied all of them ). Also an important notice: no public code is utilized in this indicato whatsoever. We've build our own flexible session mechanism, which allows you to quickly change between different type of sessions and also choose which session to use. And the big thing is our own alorithm to deal with asset, trading sessions of which are quite exotic (such as DAX and MEOX indexes, which close and open at different times of the day, which makes it hard for indicator to catch by default), so with indicator you can enjoy trading by sessions with no "bugs".
And the most user-desired and important thing: we've implemented feature to set winter and summer seasons for sessions, and this solves life-long struggle of traders to set correct trading session time, when forex exchanges switch trading hours, so now you don't need to info which our summer or winter is traded by, but just switch between seasons by one button in our indicator. And we can proudly state, no sesions indicator in the TradingView has such feature , so feel free to use it now on our indicator.
How orderblocks are built?
When London, New York or Asia ends, we find the closest orderblocks above and below closed session's high and low respectively. We do it by finding so called valid pullbacks ( was explained above ), then searching for valid fair value gap (FVG), that is inside of some valid pullbacks, and if we find it, then the orderblock is established and you will live orderblock and fair value gap (FVG) box ( both are colored in closed session's colour ).
How are orderblocks and FVG displayed on the chart?
Live orderblock and FVG are displayed as boxes on the chart, that are plolonged each bar if price didn't reach the orderblock.
Some important details:
When price touches FVG, FVG then is modified to reflect how much of untouched FVG is left. You will see it as decreasing of FVG box size in live mode. If price fully takes over FVG, FVG deletes;
When price touches orderblock, orderblock stops being prolonged and stays on the chart and is considered as worked-out.
These featues allow you to fully see live orderblocks and FVGs (if they exist) and already worked-out orderblocks to see how useful they were in the history.
Is that it?
No, because our indicator also shows sessions sweeps, which is historically a good indication that price grabbed the liquidity of previously closed sessions and now has enough "power" to do big movements, which is a good thing for traders, because it allows them to catch big movements and profit big.
Ok, we've covered the basics, now let's talk about what exactly this indicator can do.
OmnISessions is all-in-one sessions' indicator, that cointain:
Sessions (Automatic adaptation to your time zone)
Kill Zones
Silver Bullets
Session Sweeps
Order Blocks (Session, Killzone, SilverBullet)
Easily switch between summer and winter seasons
Now you don't need to look for opening and closing times of stock exchanges: the algorithm itself adjusts the session times according to your timezone. Just change the seasonality: winter/summer and the session times will be clearly displayed on your chart.
A quick view of the settings:
Show: Sessions, KillZones or SilverBullet
Season selection: Winter/Summer
Session Color Selection
Visuals:
Show/Hide session name - displays session name (ex.: London, New York, Silver Bullet and etc.) on the chart;
Show/Hide session box - displays session range as box with coloured background on the chart;
Show/Hide High/Low sessions - displays two horizontal lines for higher and lower borders of the session;
Show/Hide OrderBlocks - displays worked-out orderblocks in the history with live orderblocks and their fair value gaps (FVGs);
Show/Hide live Session High/Low - displays higher and lower border of the session as lines, that are prolonged each bar even after the session ends;
Show/Hide Session Sweeps - displays session sweeps of higher and lower border as dotted line;
Dividers (alternative session display):
Horizontal Divider
Backgrounder coloring
Customization: choose the display type: Sessions, Killzones or Silver Bullet.
The indicator displays orders that are above or below the previous session boundaries.
Below are Killzones with Order Blocks:
And this is Silver Bullet with Order Blocks:
Overall, you can clearly see that orderblocks, sessions sweeps and different type of sessions in one indicator allow you to fully utilize your time and mental energy, because finding orderblocks with valid pullbacks by hand is quite time-costly task, but finding them on different type of sessions, while not knowing trading hours of current trading session, is the true hell of work. OmniSessions indicator performs all of these calculations by itself, so you can focus on finding the best entries, while checking the situation on different sessions at the same time.
We hope that you will find great use of OmniSessions!
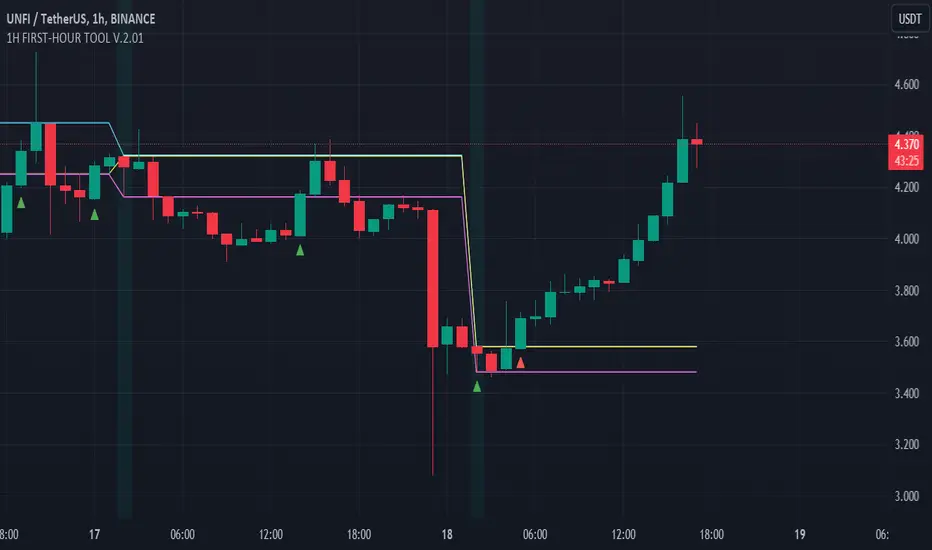
FIRST-HOUR TOOL V.1.8.08.23Three horizontal lines are drawn on the chart to represent session prices. These prices are calculated based on the user-specified session:
"FirstHour Session High" represents the highest price reached during the firsthour session.
"FirstHour Session Open" represents the opening price of the firsthour session
"FirstHour Session Low" represents the lowest price reached during the firsthour session.
These prices are respectively colored with light blue, light yellow, and light pink.
The chart background can change color based on whether the current time is within the specified session. If the current time is within the session, the background will be colored in semi-transparent aqua green. Otherwise, it will remain transparent.
Upward-pointing triangle markers are used to highlight points where the closing price crosses above (crossover) or below (crossunder) the session levels.
These markers appear below the corresponding bar.
They are colored based on the type of crossover:
Yellow for crossover above the "FirstHour High"
Red for crossover above the "FirstHour Open"
Green for crossover above the "FirstHour Low"
Alerts:
Alert messages are generated when crossovers or crossunders of the closing price relative to the session levels occur.
The alerts appear once per bar. Alerts are generated for the following events:
Crossover of the price above the "Session High" with the message "High First Hour Crossover."
Crossunder of the price below the "Session Open" with the message "Open First Hour Crossunder."
Crossunder of the price below the "Session Low" with the message "Low First Hour Crossunder."
Crossover of the price above the "Session Low" with the message "Low First Hour Crossover."
In summary, this indicator provides a visual representation of session prices and events, helping traders spot significant crossovers and crossunders relative to key price levels.
Author @tumiza999
ICT Sessions_One Setup for Life [MK]The script plots the High/Low of the following trading sessions:
London - 02:00-05:00
NY AM - 09:30-12:00
New York Lunch - 12:00-13:30
New York PM - 13:30-16:00
Due to the high level of liquidity (resting orders), highs and lows of these sessions may be used as buy/sell areas and also as profit target areas. Typically, buy orders would be initiated below a session low and sell orders would be initiated above a
session high.
The script also plots 'RTH (Regular Trading Hours) Opening Gaps'. The RTH gaps are drawn from the closing price of regular trading at 16:15 (EST) to the open price of regular trading at 09:30 (EST). Gaps can be areas that traders might anticipate to be filled at some time in the future. A gap 'midline' is available if needed and yesterday RTH close line can be shown and extended to the current bar.
This script is simply a means to draw boxes around certain areas/periods on the charts. It is in no way a trading strategy and users should spend much time to study the concept and should also perform extensive back-testing before taking any trades.
By setting the lookback value to a much higher value then the default of 6, users can utilise the script to perform their own backtesting studies.
The above chart shows the default setup of the indicator. Note that the user has to choose how far (in days) to lookback and draw the sessions/gaps.
It is also possible to show the session high//low lines and extend them to the current bar time. If this is used it is advised to keep the lookback period as low as possible to ensure charts stay clean/uncluttered.
All boxes/lines styles/colors are fully customisable.

Take Session High/Low Alert [MsF]Japanese below / 日本語説明は英文の後にあります。
-------------------------
This indicator that displays High/Low lines for each session. The Key Levels of each session can be visually recognized, which is useful for PD Array analysis. You can display the last 3 days. Based on trinity by ICT.
The biggest feature is that the color shape of the line changes when reaching High/Low. Of course, you can also set alerts.
Unreached High/Low lines can be extended to the right. hides all timeframes over 1 hour. (alert is alive)
You can choose 4 sessions. If you only want to use 3 sessions, you can do that by setting the same session time for 2 of the 4 session settings.
About Parameter Settings
Session Time: Please set it to be a 24-hour cycle. You can also specify the time zone. The default is NY time.
Basis/Other color: The first time specified in "Session Time" in this indicator's parameter is the "Basis color". "Other color" is a line other than that.
Enable Time Lines: You can turn on/off the display of vertical lines.
High/Low color: High/Low line setting that has not been reached.
Taken color: High/Low line setting that has already been reached.
Extend Lines: Allows unreached High/Low lines to be extended to the right in the chart.
-------------------------
セッションごとのHigh/Lowをライン表示するインジケーターです。
過去約3日分を表示することができます。
最大の特徴はHigh/Low到達時にラインの色形が変わることです。もちろんアラート設定も可能です。
未到達のHigh/Lowラインは右側に延長することができます。
チャート表示がビジーとなる為、1時間を超える時間足ではすべて非表示とする仕様です。(アラートは生きてます)
セッションは4つ指定できます。
もしセッションを3つのみ使用したい場合は、4つのセッション設定の内2つに同じセッション時間を設定することで実現可能です。
■パラメータ設定
Session Time:24時間周期となるように設定してください。またタイムゾーンが指定できます。デフォルトはNY timeです。
Basis/Other color:パラメータの"Session Time"にて一番最初に指定した時間が基準=Basisとなります。Otherはそれ以外のラインとなります。
Enable Time Lines:垂直ラインの表示ON/OFFが可能です。
High/Low color:未到達のHigh/Lowライン設定となります。
Taken color:到達済みのHigh/Lowライン設定となります。
Extend Lines:未到達のHigh/Lowラインを右に延長できます。

Custom Session highlighterHighlight a custom defined time range on your chart.
handy for if you trade certain hours and just let the indicator highlight that portion of the chart.
Enjoy!

BIGG CHIEFF RWB MASTER v2.0 (Indicator) [v1.0]Here is a **clean, professional TradingView indicator description** you can paste directly into the script description. It explains the *logic and philosophy* without exposing proprietary specifics, while still sounding robust and credible.
---
## 📊 Indicator Overview
This indicator is a **rule-based EMA crossover strategy built on price action, opening range structure, directional bias, and momentum confirmation**.
It is designed for intraday trading during the New York session and adapts to both time-based and tick-based charts.
The system focuses on **clarity, patience, and consistency**, filtering out low-quality conditions while aligning trades with higher-probability market structure.
---
## 🧭 Core Concepts
### Opening Range Structure
* The strategy uses the **first 15 minutes of the New York session** to define an Opening Range.
* This range establishes **key intraday structure**, including:
* High
* Low
* Midpoint
* The Opening Range remains visible for the entire session and resets each day.
* Trades are framed around **breaks, retests, and rejections** of this structure.
---
## 📈 Trend, Bias & Momentum
### Directional Bias
Bias is determined by:
* **EMA stacking order**
* **Price location relative to the Opening Range**
* Optional **higher-timeframe trend alignment**
Once bias is confirmed:
* Trades are only taken **in the direction of that bias**
* Opposing trades are locked out until structure meaningfully changes
This prevents overtrading and reduces whipsaws in choppy conditions.
---
### Higher-Timeframe Alignment (Optional)
A higher-timeframe trend filter can be enabled to:
* Keep trades aligned with the broader market direction
* Improve win rate during trending sessions
* Reduce countertrend entries
---
## ⚡ Volatility & Time Filters
To avoid low-quality trades, the system includes:
* **Volatility filtering** to prevent entries during compressed or dead markets
* **Session time windows** to focus on the most liquid trading hours
* Optional **no-trade time blocks** for news or known high-risk periods
---
## 💧 Liquidity Awareness
The indicator accounts for **key liquidity zones**, such as:
* Prior session highs and lows
* Overnight and premarket extremes
Trades are filtered to ensure there is **sufficient room for reward** before running into nearby liquidity, helping avoid premature exits.
---
## ✅ Entry Logic (Primary Mode)
Trades are based on **structure first, confirmation second**:
* Breakouts must be confirmed by **candle closes**, not wicks
* Entries occur on **retracements and rejection candles**, not chase candles
* Priority is given to cleaner retests closer to structure
* Optional controls allow limiting trades to **first-touch setups only**
This encourages patience and avoids emotional entries.
---
## 🛑 Risk Management & Trade Management
The system is built around **R-multiple consistency**, not fixed targets.
* Stops are volatility-based
* Multiple profit targets can be enabled
* Optional partial profits and trailing stop logic are included
* Trailing behavior can follow momentum or structure once price moves favorably
Everything is designed to **protect capital first and scale winners second**.
---
## 🧠 Philosophy
This indicator is not designed to predict the market.
It is designed to **react intelligently** to what price is already confirming.
It prioritizes:
* Structure over indicators
* Bias over impulse
* Confirmation over hope
* Risk management over win rate
Best results come from disciplined execution, patience, and respecting the filters.

Weekend Asia High/Low Dots + Trading Window (UTC+1)**Weekend Asia High/Low Dots & Trading Window** is a lightweight TradingView indicator designed to **mark the exact Asia session extremes on weekends (Saturday & Sunday)** and highlight predefined **trading time windows** with maximum clarity and minimal chart clutter.
The indicator focuses on **precision, simplicity, and manual trading workflows**.
---
### 🔍 Key Features
#### 🟢 Asia Session High & Low (Weekend Only)
* Tracks the **Asia session on Saturday and Sunday**
* Marks **exactly two points per session**:
* One dot at the **true wick high**
* One dot at the **true wick low**
* Dots are plotted **only once**, at the **end of the Asia session**
* **No lines, no boxes, no extensions** – just clean reference points
* Ideal for traders who prefer to **draw their own ranges manually**
#### 🟩 Trading Window Highlight
* Customizable **trading time windows** for Saturday and Sunday
* Displayed as a **clean outline box** (no background fill)
* Helps visually separate **range formation** from **active trading hours**
---
### ⏰ Time Handling
* All session times are defined in **UTC+1**
* Uses a **fixed UTC+1 timezone** (`Etc/GMT-1`) for consistent behavior
* Easily adjustable to other timezones if needed
---
### ⚙️ Customizable Inputs
* Asia session times (Saturday & Sunday)
* Trading session times (Saturday & Sunday)
* Optional trading window labels
* Easy point size adjustment directly in the code
---
### 🎯 Use Cases
* Weekend trading (Crypto, Indices, Synthetic markets)
* Asia range analysis
* Manual range drawing & breakout planning
* Clean, distraction-free chart layouts
---
### 🧠 Who Is This Indicator For?
* Price action traders
* Range & session-based traders
* Traders who prefer **manual chart markup**
* Anyone trading **weekends with structured time windows**
---
### 🛠 Technical Details
* Pine Script® **Version 6**
* Overlay indicator
* Optimized for clarity and performance
---
If you want, I can also provide:
* a **short description** (1–2 lines for the TradingView header)
* **tags & keywords** for better discoverability
* or a **version with user-adjustable dot size via Inputs**

FestX VSTFestX NY Session Volume Framework is a session-based momentum and liquidity indicator designed specifically for the New York market open.
The script focuses on time-based market behaviour, filtering signals to only occur at precise session transitions where institutional volume is statistically higher.
Core Concepts Used:
• Session Transition Logic
Signals are only evaluated when the New York trading session opens, eliminating noise from low-liquidity periods.
• Relative Volume Expansion
Instead of raw volume, the script compares current volume against a rolling average to detect abnormal participation at the session open.
• Directional Candle Validation
Entry bias is derived from the relationship between candle open and close at the session trigger, aligning trades with immediate momentum.
• Optional Session Range Context
The tool can be used alongside Asian session highs and lows to identify continuation or reversal behaviour after range compression.
What Makes This Script Different:
This indicator does not attempt to predict direction throughout the day.
It deliberately restricts signals to one specific institutional window, using volume expansion + price acceptance to confirm direction.
This design reduces overtrading and focuses traders on high-quality, time-based opportunities rather than constant signals.
Intended Use:
• NY session open traders
• Index and futures traders
• Traders seeking confirmation at session transitions
This script is not a traditional trend indicator or oscillator and is best used as a contextual decision tool, not a standalone signal generator.

Session Fibonacci Tracker with Dynamic Range FreezeSession Fibonacci Tracker with Dynamic Range Freeze
This indicator plots Fibonacci retracement and extension levels based on session high/low ranges with a unique "freeze" mechanism that locks levels during volatility and recalculates only when price returns to the established range.
How It Works:
The indicator uses a three-stage process to maintain stable Fibonacci levels:
Range Establishment: At the start of each session (default 1800 ET), the indicator tracks the session high and low. Fibonacci levels are calculated with dynamic anchoring - when price is above the session open, 0 anchors at the high with 1 at the low; when below, 0 anchors at the low with 1 at the high.
Freeze Mechanism: Once the range is established, it immediately freezes. If a candle closes outside this range, the Fibonacci levels remain locked at their current values even as new session highs or lows form. This prevents levels from constantly recalculating during trending moves.
Recalculation: The frozen range only updates when price action (high or low) touches back inside the established range. At this point, levels recalculate based on the current session high/low, then freeze again.
Key Features:
Customizable Fibonacci levels: All retracement (0.236, 0.382, 0.500, 0.618, 0.786) and extension levels (-1.0, -0.618, -0.272, 1.272, 1.618, 2.0) can be enabled/disabled and adjusted to custom values
Time-based line extension prevents historical buffer overflow errors
Works across all timeframes
Session start time fully customizable
Visual status indicator shows whether levels are frozen or active
All lines and labels are fully customizable (colors, width, labels, prices)
Use Cases:
This indicator is particularly useful for traders who want stable reference levels during volatile periods. Traditional Fibonacci tools recalculate with every new extreme, making them difficult to use as support/resistance during trends. This implementation keeps levels stable until price returns to consolidation, providing consistent reference points for entries, exits, and stop placement.
Settings:
Session Settings: Configure session start time (default 1800 ET)
Fibonacci Levels: Enable/disable and customize each retracement level value
Extension Levels: Enable/disable and customize each extension level value
Visual Settings: Adjust line extension, width, labels, and price display
Colors: Customize colors for open line, 0 level, 1 level, retracements, and extensions


Trendslinger CVDCVD - Cumulative Volume Delta
Cumulative Volume Delta (CVD) tracks the running total of buying versus selling pressure by analyzing volume distribution within each price bar. This indicator visualizes order flow dynamics to help identify accumulation, distribution, and potential trend reversals.
How It Works
CVD calculates the "delta" (difference between buying and selling volume) for each bar and accumulates it over time. Two calculation methods are available:
Close Position: Estimates buy/sell volume based on where price closes within the bar's range. A close near the high suggests more buying pressure; a close near the low suggests more selling pressure.
Polarity: Simple method where green candles count as buy volume and red candles count as sell volume.
Key Features
Multiple Display Types: View CVD as candlesticks, line, histogram, area, or columns
Flexible Reset Options: Reset CVD hourly, daily, or weekly for cleaner intraday analysis
Divergence Detection: Automatically identifies bullish and bearish divergences between price and CVD
Session Tracking: Optional high/low reference lines for the current session
Smoothing Options: Apply SMA, EMA, WMA, or RMA smoothing to reduce noise
Info Table: Real-time display of current CVD value, bar delta, and session extremes
Built-in Alerts: Zero line crosses, divergences, and new session highs/lows
How To Use
Trend Confirmation: Rising CVD confirms bullish price action; falling CVD confirms bearish moves
Divergences: Price making new highs while CVD makes lower highs signals weakening buying pressure (bearish). Price making new lows while CVD makes higher lows signals weakening selling pressure (bullish)
Zero Line: CVD crossing above zero suggests buyers taking control; crossing below suggests sellers dominating
Hourly Resets: Useful for scalping and intraday trading to track momentum within each hour
